matchms.plotting package
Functions for plotting one or multiple spectra
Matchms provides (limited) plotting functionality to display one or multiple
spectra from Spectrum objects.
Currently this includes 3 different plot types:
plot_spectrum(spectrum) or spectrum.plot() This will create a plot of an individual spectrum.
plot_spectra_mirror(spectrum1, spectrum2) or spectrum1.plot_against(spectrum2) This will create a mirro plot comparing two spectra.
plot_spectra_array([spec1, spec2, …]) This will create a plot with an array of all spectra in the given list.
Example of how to visually compare two spectra:
import os
from matplotlib import pyplot as plt
import matchms.filtering as msfilters
from matchms.importing import load_from_msp

module_root = os.getcwd()
spectra_file = os.path.join(module_root, "matchms", "tests", "MoNA-export-GC-MS-first10.msp")
spectra = list(load_from_msp(spectra_file))
spectra = [msfilters.default_filters(s) for s in spectra]

spectra[1].plot()
# plt.savefig("spectrum-plot-example_1.png", dpi=300)  # If you want to save a plot
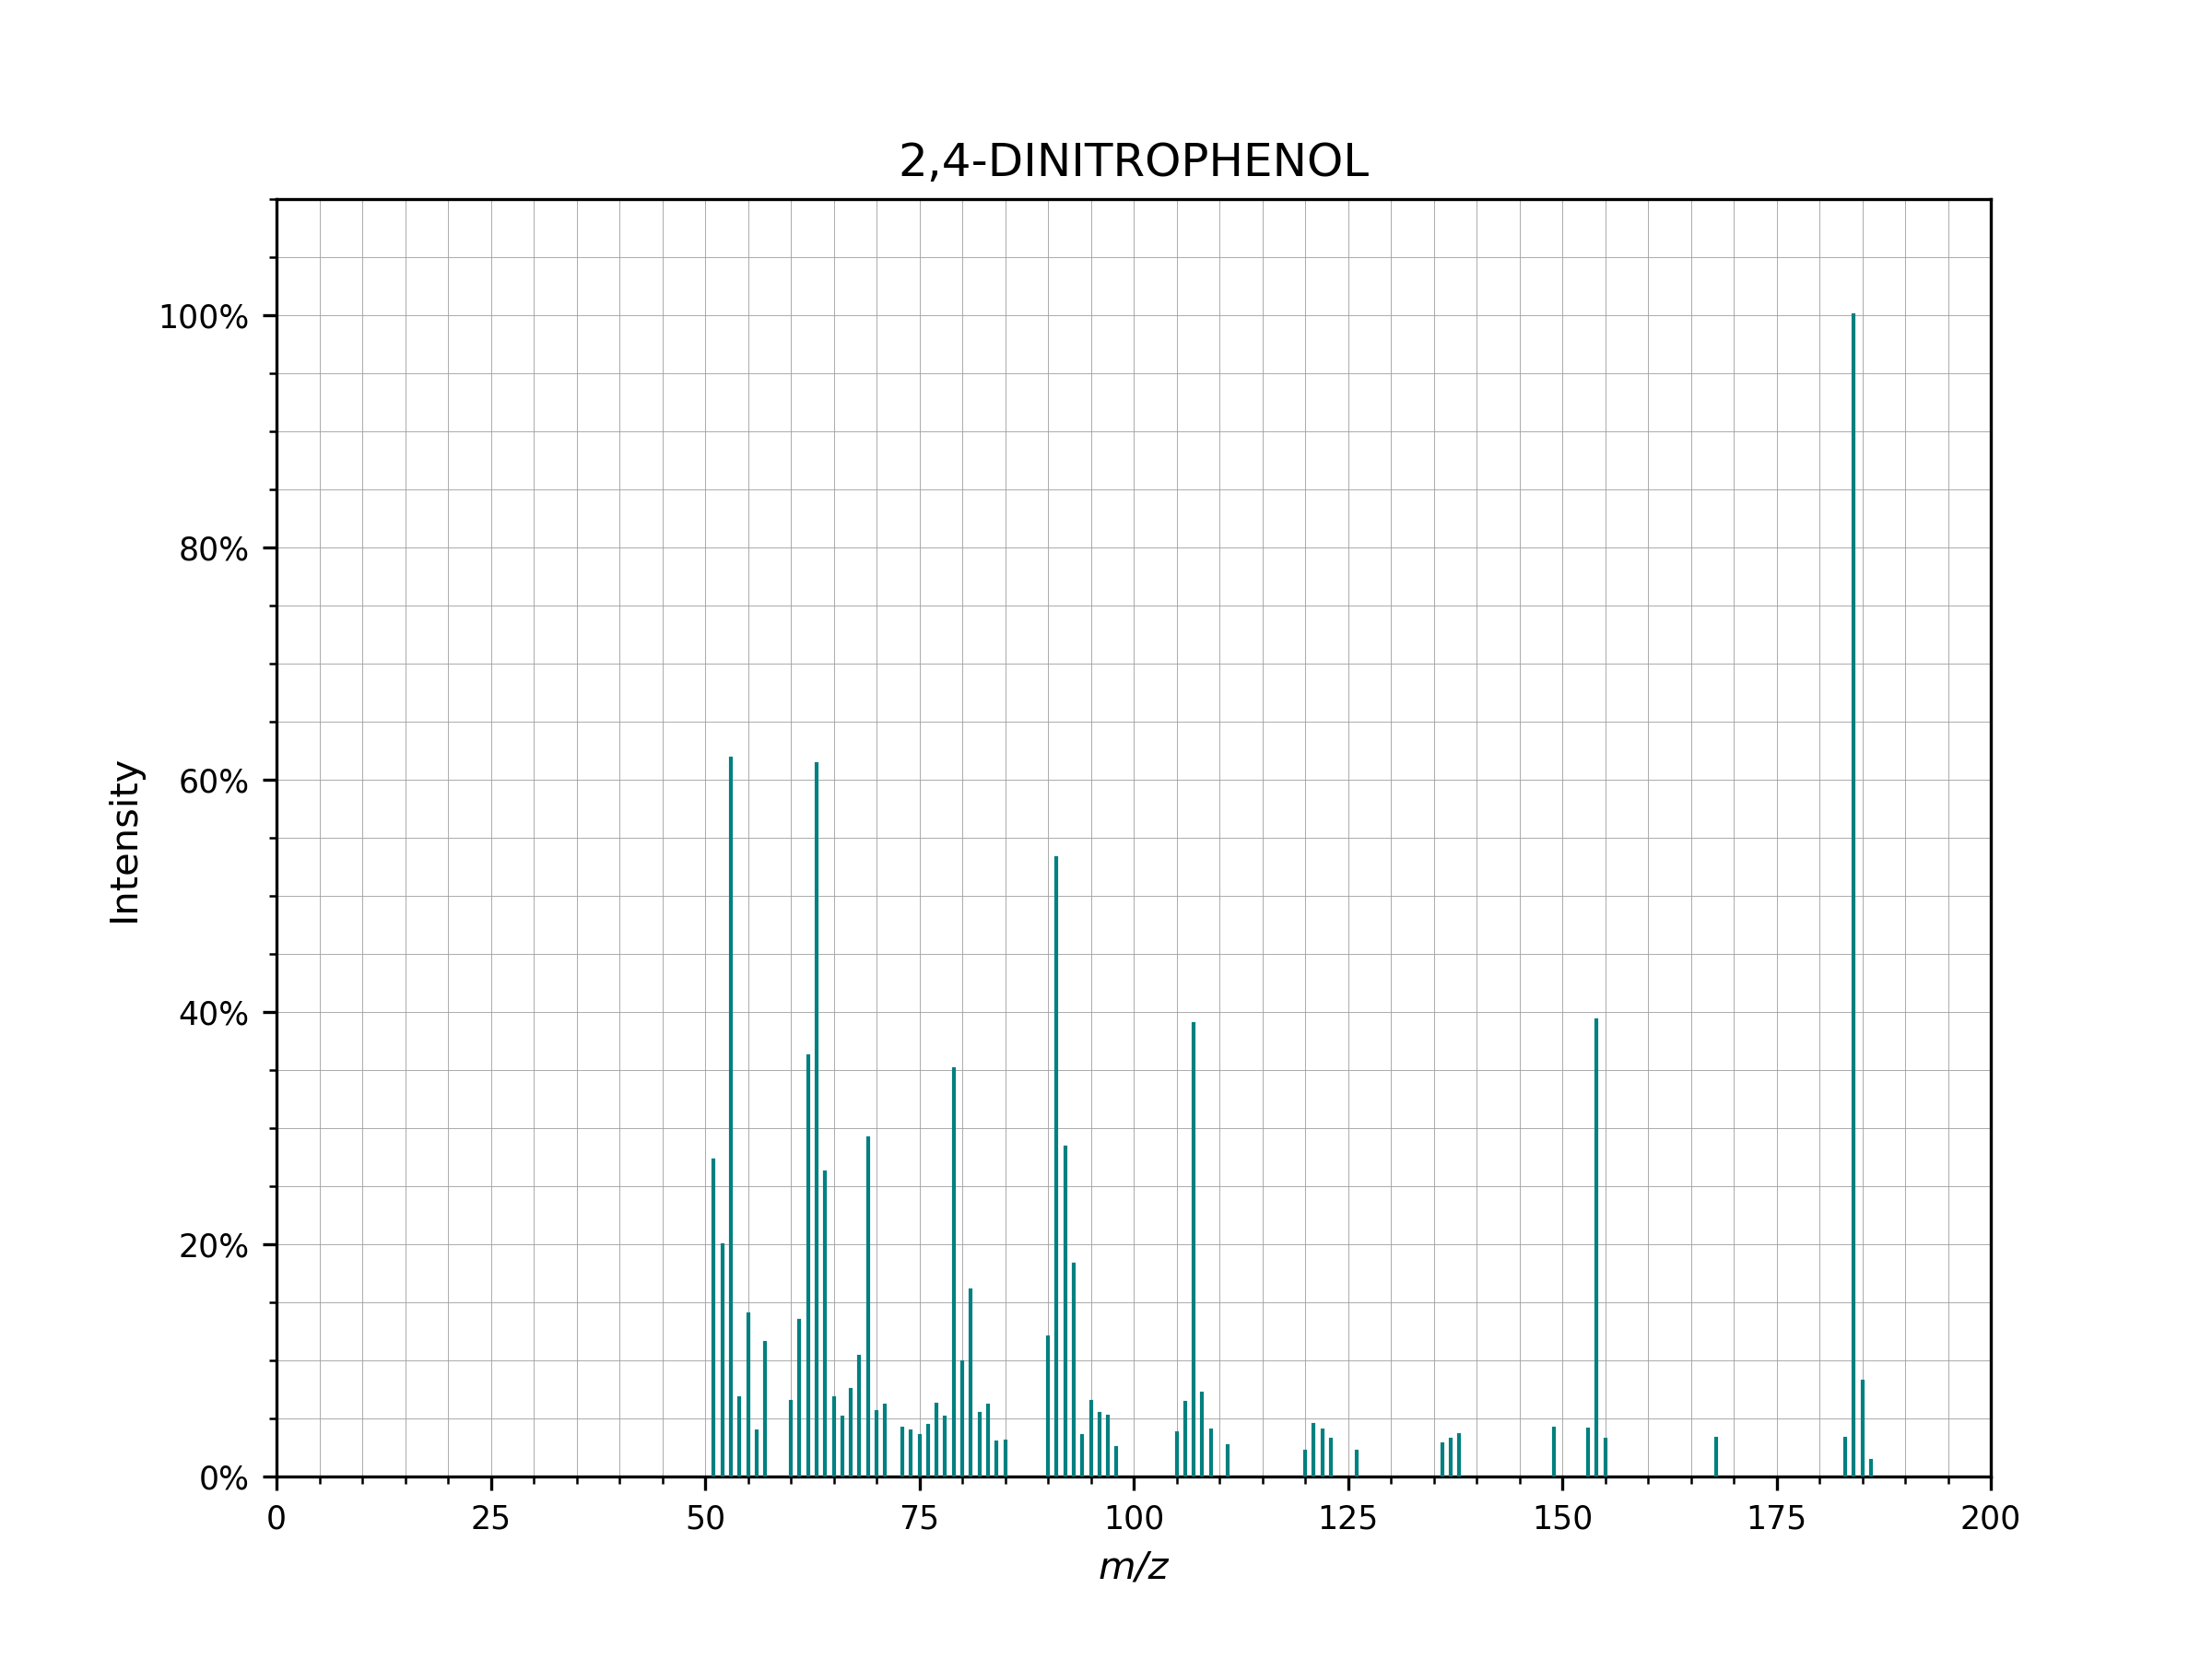
Plot of individual spectrum.
Another example is to compare two spectra visually using a mirror plot:
spectra[2].plot_against(spectra[3])
plt.xlim(0, 200)
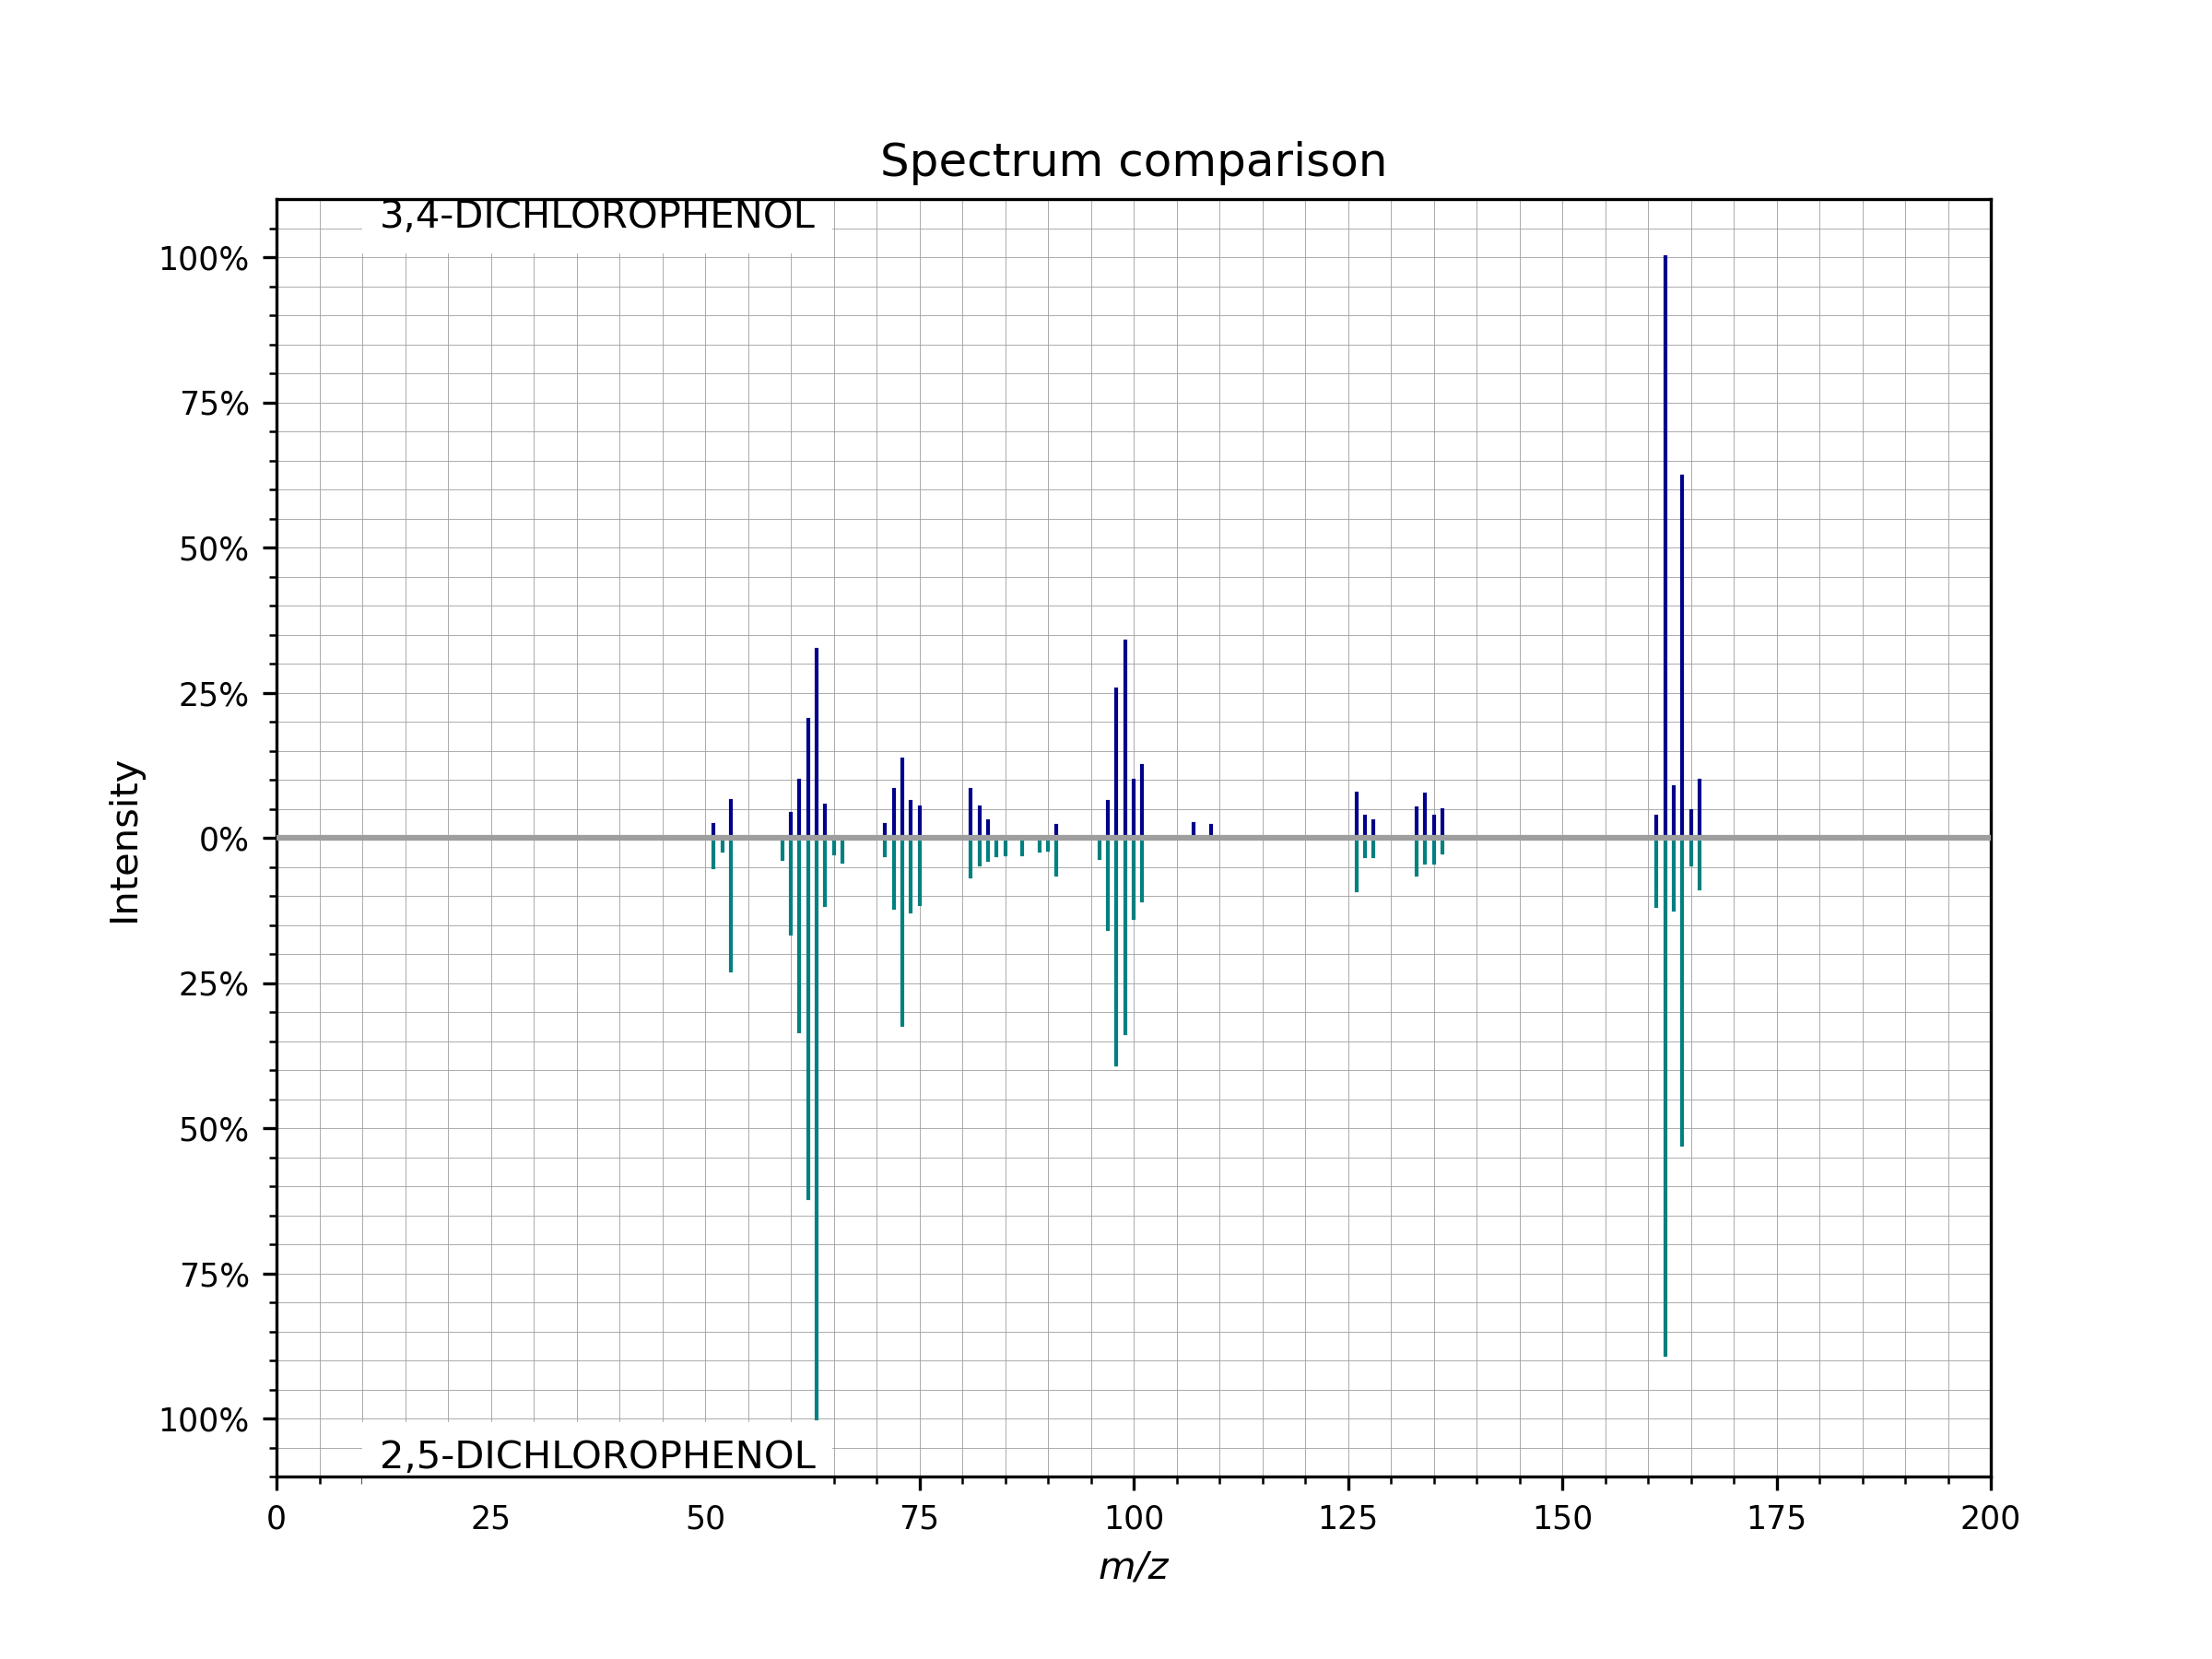
Compare two spectra visually using a mirror plot.
Finally, it is also possible to plot many spectra at once using plot_spectra_array():
from matchms.plotting import plot_spectra_array

plot_spectra_array(spectra[:4])
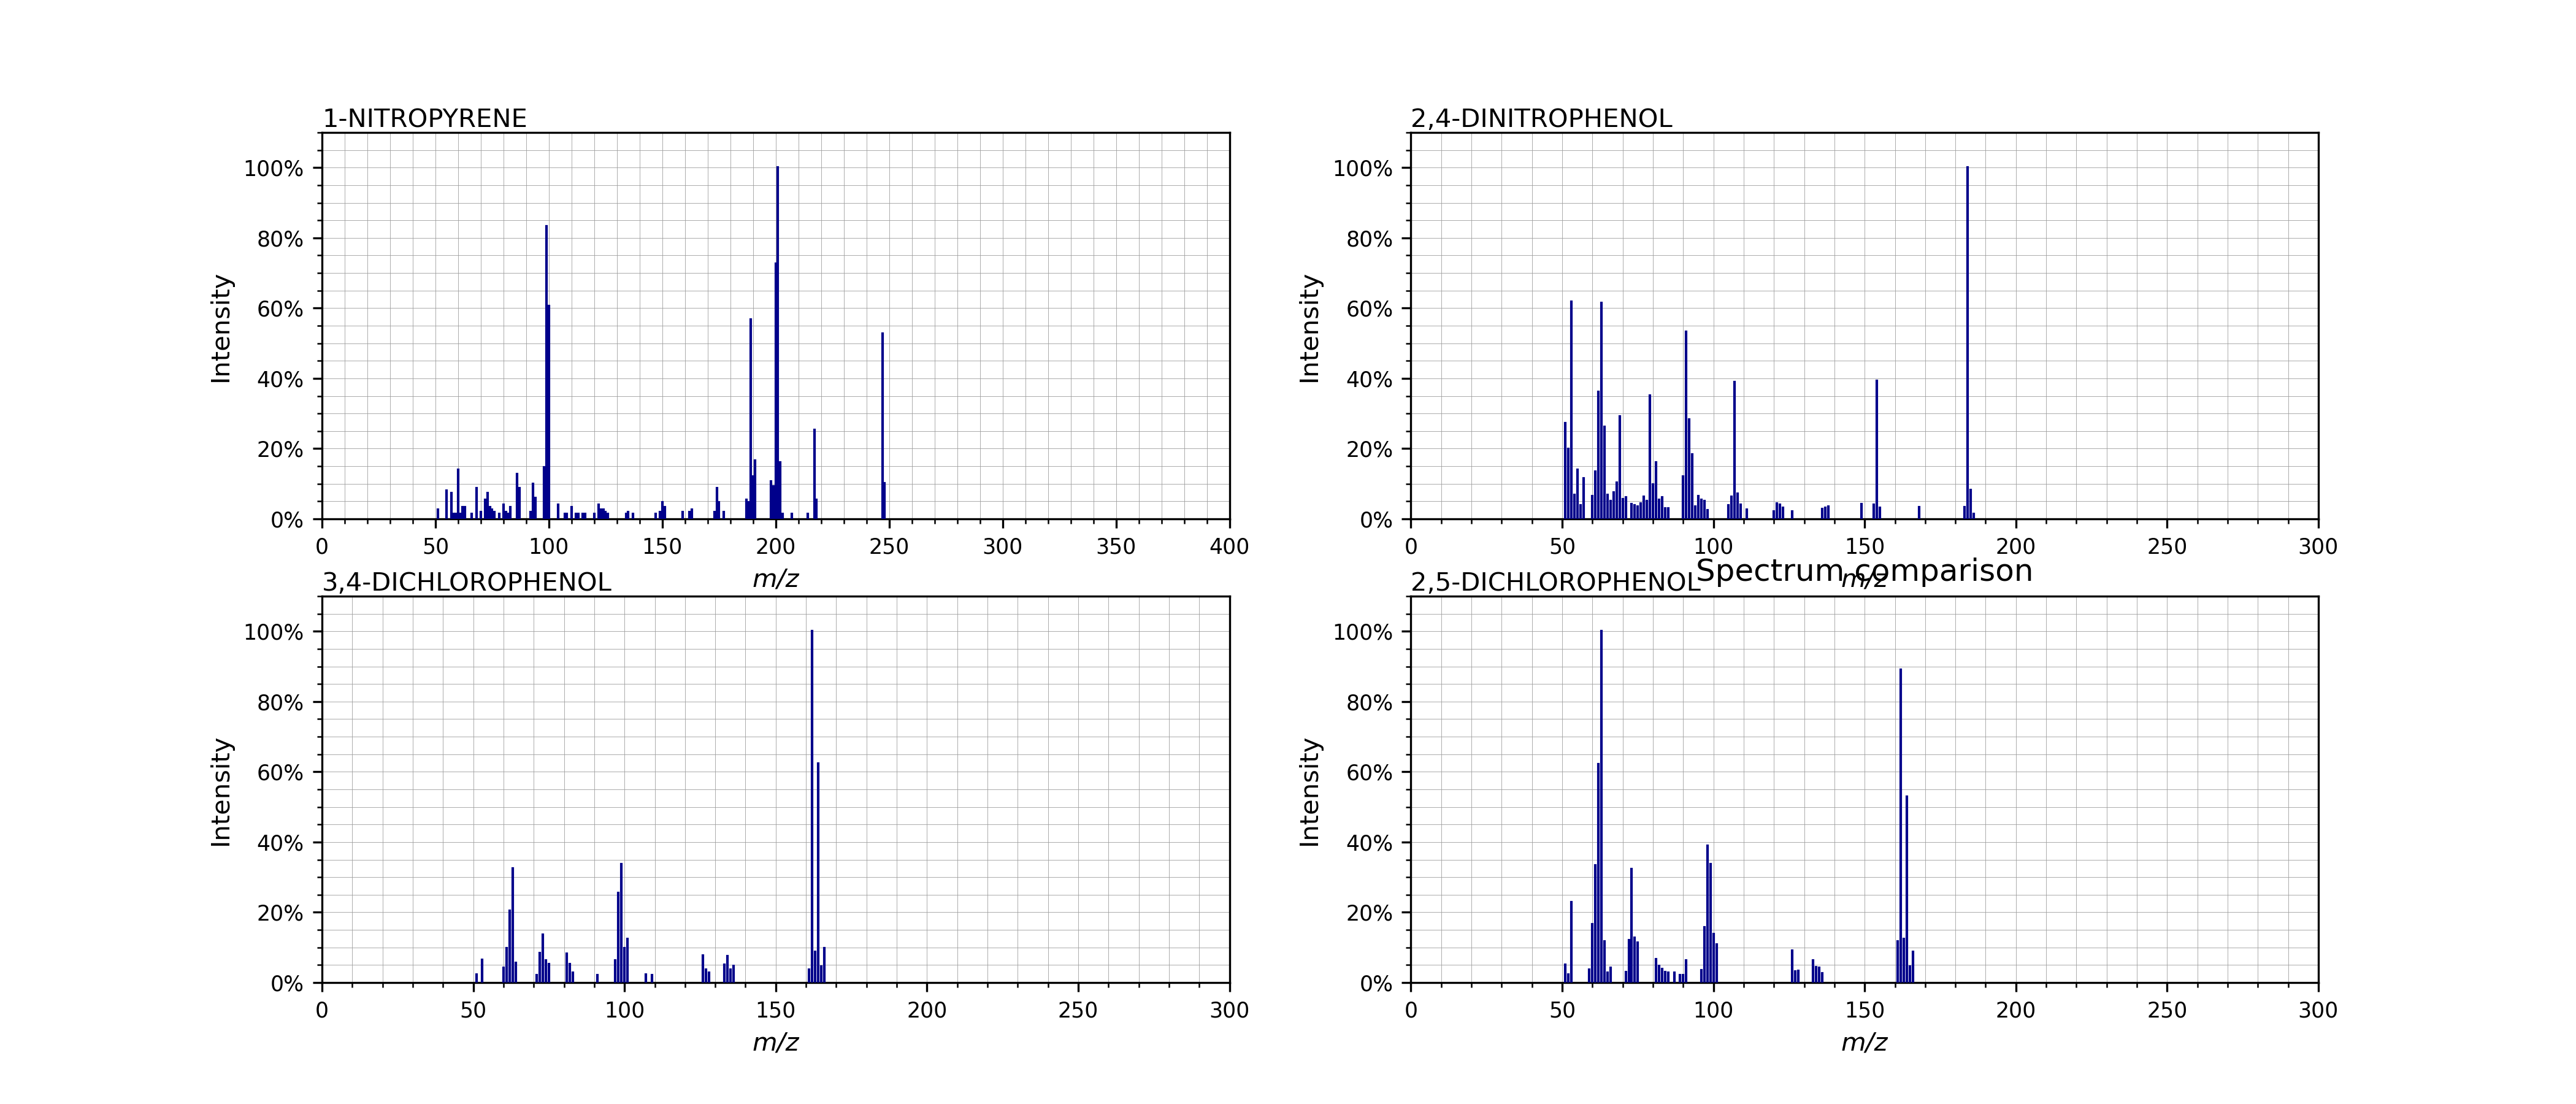
Compare many spectra visually using an array plot.
- matchms.plotting.plot_spectra_mirror(spec_top, spec_bottom, ax: Axes | None = None, color_top='darkblue', color_bottom='teal', **spectrum_kws) Axes[source]
Mirror plot two MS/MS spectra.
Code is largely taken from package “spectrum_utils”.
- Parameters:
spec_top (matchms.Spectrum.Spectrum.Spectrum) – The spectrum to be plotted on the top.
spec_bottom (matchms.Spectrum.Spectrum.Spectrum) – The spectrum to be plotted on the bottom.
ax – Axes instance on which to plot the spectrum. If None the current Axes instance is used.
color_top – Set color of peaks in top spectrum.
color_bottom – Set color of peaks in bottom spectrum.
spectrum_kws – Keyword arguments for plot_spectrum().
- Returns:
The matplotlib Axes instance on which the spectra are plotted.
- Return type:
plt.Axes
- matchms.plotting.plot_spectrum(spectrum, annotate_ions: bool = False, mirror_intensity: bool = False, grid: bool | str = True, ax: Axes = None, peak_color='teal', min_mz: float = None, max_mz: float = None, **plt_kwargs) Axes[source]
Plot a single MS/MS spectrum.
Code is largely taken from package “spectrum_utils”.
- Parameters:
spectrum (matchms.Spectrum) – The spectrum to be plotted.
annotate_ions – Flag indicating whether or not to annotate fragment using peak comments (if present in the spectrum). The default is True.
mirror_intensity – Flag indicating whether to flip the intensity axis or not.
grid – Draw grid lines or not. Either a boolean to enable/disable both major and minor grid lines or ‘major’/’minor’ to enable major or minor grid lines respectively.
ax – Axes instance on which to plot the spectrum. If None the current Axes instance is used.
peak_color – Set color of peaks in plot.
min_mz – Set lower limit of the plots x-axis to min_mz. Default is None.
max_mz – Set upper limit of the plots x-axis to min_mz. Default is None.
- Returns:
The matplotlib Axes instance on which the spectrum is plotted.
- Return type:
plt.Axes